
Hardware Solutions
Applications
 Part of the Oxford Instruments Group
Cell Biology
Yuko Mimori-Kiyosue from RIKEN Center for Life Science Technologies in Kobe, Japan and colleagues are using an advanced form of light-sheet microscopy with Imaris software to track 3D microtubule growth dynamics within the cell’s mitotic spindle apparatus.
The mitotic apparatus is made of hundreds of microtubules and ensures the correct segregation of chromosomes into each daughter cell during cell division. “It is important to precisely analyze the dynamics of the mitotic apparatus to better understand the molecular mechanisms involved in its regulation, failure of which will lead to variety of genetic disorders including cancer and Down's syndrome,” explains Mimori-Kiyosue.
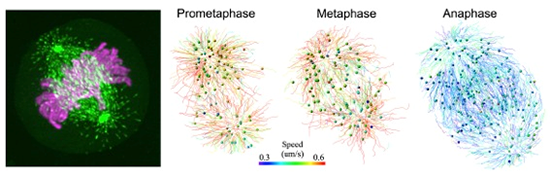
The left image shows a metaphase HeLa cell expressing EB1-GFP (green) and H2B-TagRFP (magenta) collected by lattice light-sheet microscope. The right images show representative images of EB1-GFP trajectories at different mitotic phases, with the trajectories generated by automated 3D tracking. Results from the first 30 frames are shown with a color code designating the moving speed. The color bar indicates the speed range for the mean speed of EB1-GFP comets (0.3-0.6 microns per second). Image courtesy of Yuko Mimori-Kiyosue.
Although some imaging methods can achieve indirect visualization of microtubule dynamics within the mitotic spindle, the researchers developed a method that allows direct observation of all the individual filaments within the spindle apparatus. This was possible thanks to a recently developed technique called lattice light-sheet microscopy. This technology creates an ultrathin light sheet from a massive parallel array of nondiffracting light beams that mutually interfere. Lattice light-sheet microscopy spreads the excitation light across many foci, which greatly reduces fluorescence photobleaching and phototoxicity and thus allowing imaging of hundreds of volumes in whole cells at subsecond intervals.
Seeing inside the spindle in 3D
The researchers combined lattice light-sheet microscopy with the EB1-GFP microtubule growth marker previously developed by Mimori-Kiyosue, new mathematical computational techniques, and Imaris software to image the cells interior at unprecedented spatiotemporal resolution and to visualize microtubule growth dynamics inside the spindle in 3D for the first time.
The researchers used Imaris to display data in 3D and to automatically track EB1-GFP, which marked microtubule growth. They also used the Imaris "slice" tool to look deep inside the mitotic apparatus, allowing them to see 3D volume data.
“Imaris is a pioneering and highly user friendly image analysis software for multi-dimensional data,” Mimori-Kiyosue says. “Imaris can display images and tracking results in a single window, which allows us to edit the tracks easily.” The side-by-side view let the researchers use the manual edit option to easily eliminate any erroneous tracks or tracks that were not from the target cell by directly comparing them with the original image.
Understanding how mitotic failure can lead to cancer
Using the new imaging approach, the researchers analyzed both the speed and direction of microtubule growth at different regions within the mitotic spindle apparatuses in 3-D. They plan to use their new approach to reveal novel mechanisms involved in initiating cancer after mitotic failure. By quantifying the dynamics of different portions of microtubules such as, astral microtubules, kinetochore fiber, and interpolar microtubules, the researchers can see subtle changes that might reveal how important cancer-related molecules affect this important cell machinery.
“This is an important technology for enabling next generation 3D cell biology. Previously we have never been able to track 3D motions of fine structures inside cells,” Mimori-Kiyosue says. “However, this multidimensional image analysis approach is useful for any type of 3D motion analysis, such as vesicle tracking and membrane morphogenesis, chromosome shape and movement, organelle distribution, and changes in cell shapes.”
© Oxford Instruments 2024
