
Hardware Solutions
Applications
 Part of the Oxford Instruments Group
César Nombela-Arrieta, Alvaro Gomariz, and colleagues from University Hospital and University of Zurich combined Imaris with custom software to learn more about the structural organization of bone marrow tissues, where trillions of blood cells are produced on a daily basis. A full understanding of the spatial and molecular features of bone marrow niches involved in this process, termed haematopoiesis, could one day allow scientists to culture blood cells and is essential for understanding blood diseases and cancers.
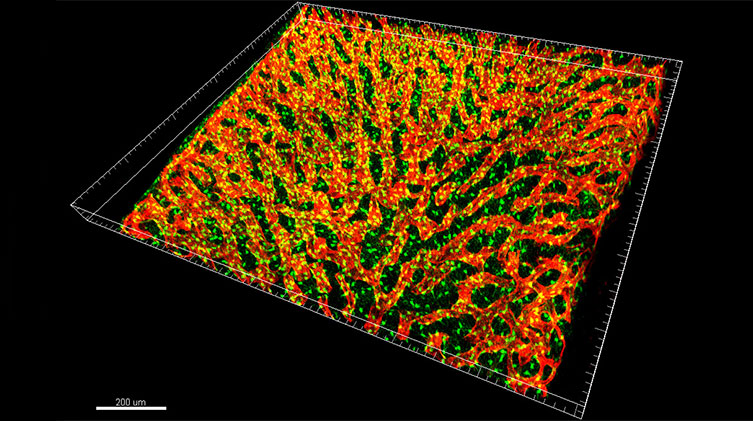
This 3D rendering is of a representative confocal image stack of murine bone marrow tissues. The red channel depicts the vascular-specific marker endomucin, and the green signal corresponds to CXCL12-GFP, which labels the fibroblastic mesenchymal CXCL12-abundant reticular cell (CARc) stromal population. Courtesy of Nombela-Arrieta’s lab, University Hospital and University of Zurich.
Detailed visualization
The process of ensuring that enough blood cells are created to meet the body’s needs is regulated by signals from stromal cells of non-hematopoietic origin. Interactions between stromal cells and individual haematopoietic cells occur in spatially confined anatomical niches in the bone marrow. Sinusoidal endothelial cells and mesenchymal CXCL12-abundant reticular cells (CARcs) found in the bone marrow stromal components play a critical role in modulating haematopoiesis. For example, they are critically involved in maintaining haematopoietic stem cells.
According to the authors of the study, the dissection of relevant cellular interactions in the global context of bone marrow tissues can only be achieved through detailed visualization of different cell types, their quantification, and their analysis through spatial statistics. Thus, image-based spatial characterization of these stromal cells and structures is crucial to define the microenvironments in which blood cells are maintained.
To facilitate image-based study of bone marrow niches, the researchers previously developed an approach for generating slices of bone marrow tissues that are then optically cleared. This process allows registration of organ-wide optical sections acquired using confocal microscopy by processing and rendering large multidimensional image datasets.
“Imaris software largely facilitates this work by enabling fast and versatile navigation of datasets in different dimensions,” said Gomariz, co-first author and bioimage analyst. “Most importantly, the software permits integration of customized software in the form of plugins written in Python or Matlab, which has allowed us to fully combine the capabilities of Imaris with our tailored analytical pipelines in an interactive and user-friendly way.”
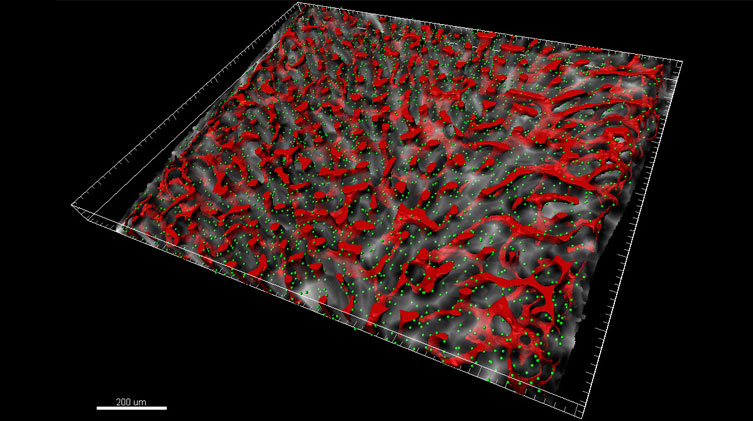
The researchers used Imaris to segment the sinusoidal microvasculature (venous equivalent of the bone marrow) and render it as a surface, shown in red. CARc are detected with Imaris Spots function and represented as green spheres while the empty space distance transform to the sinusoids is represented in a grayscale. Courtesy of Nombela-Arrieta’s lab, University Hospital and University of Zurich.
Incorporating custom analysis tools
The researchers used Imaris image processing modules to analyze the number, distribution, and spatial coverage of CARcs and sinusoidal endothelial structures in the bone marrow of young and aged mice. The Imaris Spots module allowed them to determine coordinates of CARc, and the Surfaces module was used to segment the endothelial walls of sinusoidal microvessels. Segmenting the lumen of each microvessel posed a major image-processing challenge because they don’t emit a specific fluorescent signal.
“Thanks to the Imaris programming interface, we were able to custom-build processing tools that permitted full vascular segmentation and reconstruction using the surfaces previously created and rendered in Imaris,” said Gomariz. They also created an analysis pipeline that used both the spots (cells), and the surfaces (vessels or other spatially extended structures) to study their distribution and potential interactions.
The quantitative 3D spatial analysis showed that sinusoids and CARcs are substantially more abundant and spatially extended than the researchers initially thought. They also found that these cells strictly constrain the available space for other cells to spatially arrange. This means that even without any specific forces mediating interactions, most of the bone marrow cells were in contact with the stromal structures the researchers examined.
The researchers plan to expand the visualization and processing capabilities available by combining Imaris with their custom analysis pipeline to achieve fast, reliable and fully automatic identification of different anatomical landmarks and cell types. “Our goal is to create a detailed and integrated map of cellular anatomy in the bone marrow in health and disease,” said Nombela-Arrieta.
Research paper: Gomariz A, Helbling PM, Isringhausen S, Suessbier U, Becker A, Boss A, Nagasawa T, Paul G, Goksel O, Székely G, Stoma S, Nørrelykke SF, Manz MG, Nombela-Arrieta C. 2018. Quantitative spatial analysis of haematopoiesis-regulating stromal cells in the bone marrow microenvironment by 3D microscopy. Nat Commun. 2018 Jun 28;9(1):2532.
© Oxford Instruments 2024
