
Hardware Solutions
Applications
 Part of the Oxford Instruments Group
Tutorial
May 2014
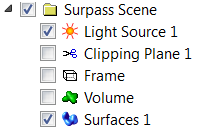
This tutorial describes how Imaris can be used to quantify chromatin modifications in 3D whole-mount plant tissue images. The approach shown here, is applicable to a wide range of plant tissue and can be used to quantify fluorescently labeled proteins targeted to the chromatin.
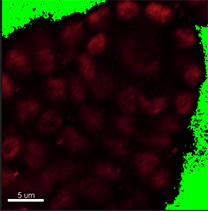
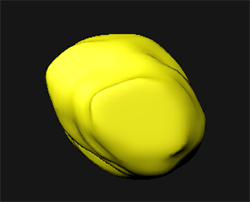
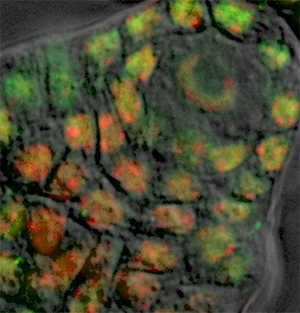
The image is courtesy of Wenjing She and Dr. Célia Baroux from the University of Zürich in Switzerland. The image series was recorded using resonance confocal laser microscopy and report on chromatin immunostaining in a whole-mount ovule primordium of the model plant Arabidopsis thaliana.
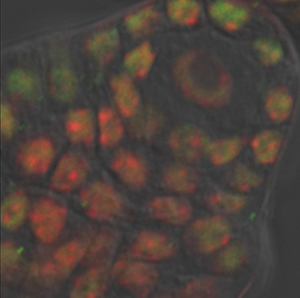
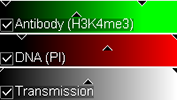
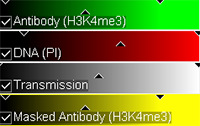
The green signals show the trimethylated lysine 4 on the histone three chromatin modification, the red signals show DNA counterstained with propidium iodide. In the grey channel are images in transmission light.
Scanning Conditions
An important aspect to quantitative imaging is to avoid signal saturation. For this record the antibody dilution should be calibrated. In addition, it is critical to record images of several samples under the same scanning conditions, in terms of:
It is best to avoid a brightness reinforcement acquisition mode, or an excess of gain beyond the full dynamic range of the photomultiplier. It is advisable to use a photon-counting mode or to visualize the dynamic range from a look-up table.
Dynamic Range Verification
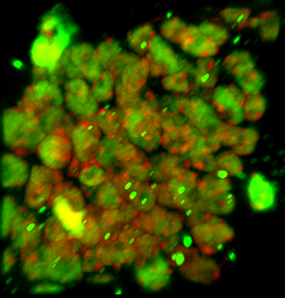
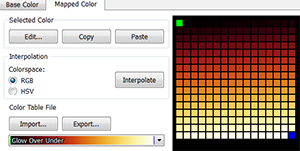
To verify the dynamic range of your image, remove the display of the transmission light channel. Than for the other fluorescence channel choose the mapped color option  Glow Over Under.
Next, to examine the homogenous distribution of the signals throughout the cell layers, browse through the series using the Slice  mode. A series showing slices with no or reduced signals is inappropriate for quantification. After that, you can then leave it as it is or change it to the original colors.
-20180608145414.png)
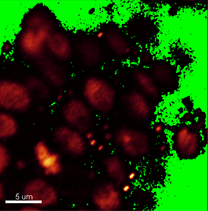
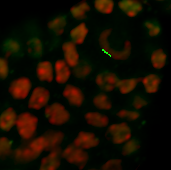
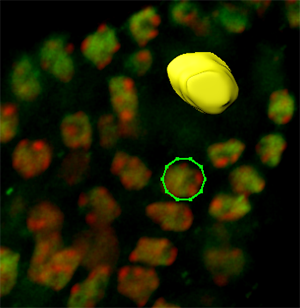
Verify shape and size of nuclei to decide whether the segmentation can be done automatically or manually. In this image, however, the nuclei have distinct shape and size depending on the cell type. Here, in the DNA staining channel the spore mother cell located in a subepidermal position in the primordium has an elongated nucleus of irregular contour making it unsuitable for automatic contour detection.
Due to irregular shape and size of the nuclei, in this example, segmentation will be done using the manual contour surface. To provide an unobstructed slice view, switch off the volume and create a new Surface.
Manual Surface Creation
First, you have to cancel the automatic Surface creation wizard. You can do that either by clicking on the Cancel button  or by selecting the Skip automatic creation, edit manually
  button.
Under the Board tab, use the slider to move through the slices to identify the most representative slice for the nucleus volume, in this example that is the middle slice. The Visibility option controls the display of previously drawn contours. To see only the contour currently being drawn under the Visibility option, choose None.
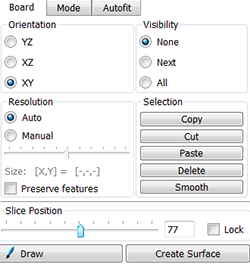
Under the Mode tab you can see different contour drawing options. For nuclei of regular contour and shape, the isoline drawing mode is appropriate. However, select the distance mode to segment nuclei with atypical counter such as the spore mother cell in our image.
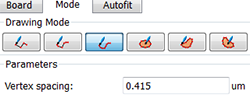
Before starting with the first contour line, switch the pointer from the Navigate to Select mode by pressing the Esc key and activate the drawing mode by pressing the Draw  button. In the viewing area, a cross appears and then you can start the first contour. Click once to insert the first point and then simply move the mouse along the area of interest.
-20180608145832.png)
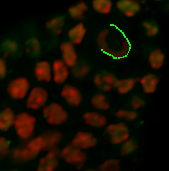
Under the Board tab, the contour can be smoothed if necessary. According to the size of the object you wish to segment, on the next slice you can ether draw a new contour or you can copy and paste the contour from the previous slice. If you want to copy the same shape to the selected plane click on the Copy button. Change to the next drawing plane by moving the Slider and click on the Paste button. Paste the contour as long as it fits the object otherwise you have to create a new one.
To minimize the bias inherited in all manual methods, open the display adjustment window and increase the brightness of the slices where the signal is fading. This will not change the pixel intensity for the quantification as only the display is modified. Repeat the procedure until all necessary contours are created. Draw contour lines for the whole nucleus, but as Imaris can extrapolate the surface through the slices you do not need to draw a contour for every slice.
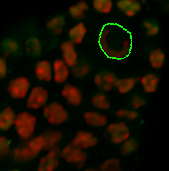
When you are satisfied with the created contour lines, click on the Create Surface button  to create a surface between the previously drawn contours. And to visualize it click on the Settings
  tab.
tab.
Verifications Steps
Whenever the manual steps are used verifications steps are recommended. To verify whether the surface accurately captures the volume of your region of interest under the Edit tab  select the Mask option. Select the channel you want to mask. Before applying the mask check the duplicate channel box and set the voxel outside surface to zero.
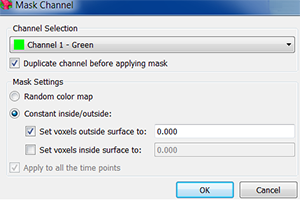
An additional masking channel is automatically created. To help verifying the segmentation accuracy adjust the color and brightness of this new channel and select the Slice mode.
Use the slider to change the slice you are viewing. As you scroll through the slices check the segmentation results.
Surface Creation for Surrounding Somatic Cells
In this image, in transmission light we can visualize the spore mother cell in the center of the primordium, which is a large cell that will undergo meiosis, and smaller, somatic surrounding cells to correlate measurements on different cell types here we can create surfaces by quantifying specific cell signals.
In the Surpass tree click on create Surfaces , cancel automatic Surface creation, and follow the same procedure for initiating the contour creation.
The cells surrounding the spore mother cell have nuclei with a more regular and round shape, therefore the contour definition can best be achieved by using the Circle  drawing mode. As name suggests, the cycle tool inserts the circular contour line. The size of the contour circle can be adjusted by using the mouse wheel, while the cursor position indicates the center of the contour.
Draw contour lines for all necessary slices and create a new surface by clicking on the Create Surface button. Please note that, to edit drawn contours and to optimize surface creation various additional algorithms are available such as magic wand and the rebuild functionality.
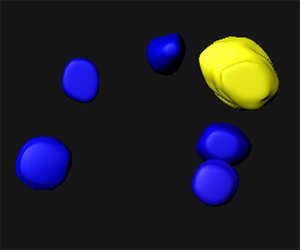
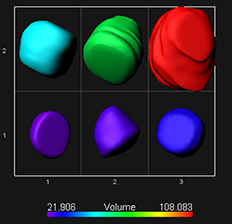
As our image contains only one spore mother cell for a hundred of somatic surrounding cells, the contours are drawn for the mother cell and five others. In the viewing area manually created surfaces are displayed.
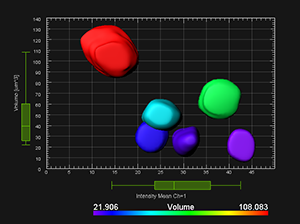
The intensity of the green channel corresponds to the level of chromatin modification while the intensity of the red channel measures the DNA content. For each surface under the Statistic tab  the Detailed calculation shows the Intensity sum.
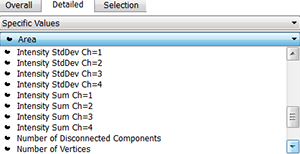
To normalize the measured chromatin in each nucleus use the intensity sum values for channel 1 and channel 2.Values for each surface and each channel can be exported into excel for further processing. The cromatin modification content is normalized to the DNA content based on 20-30 replicate sample per treatment The normalized levels in the spore mother cell is expressed relative to the level of the surrounding somatic cells in each sample and the overall distribution across several replicates is statistically evaluated.
More information related to the data used for this video tutorial can be found in the publication by Wenjing She, Célia Baroux and collaborators: Chromatin reprogramming during the somatic-to-reproductive cell fate transition in plants (http://dev.biologists.org/content/early/2013/09/04/dev.095034.full.pdf+html).
© Oxford Instruments 2024
