
Hardware Solutions
Applications
 Part of the Oxford Instruments Group
Cell Biology
Dr. Arnaud Chevrollier, Biochemistry Department of the University Hospital, UMR6214, Inserm U1083, Angers.
Researchers led by Arnaud Chevrollier from University Hospital in Angers, France are revealing new information about mitochondrial dynamics by combining Imaris with micro patterned coverslips (Cytoo SA). Their new technique allows standardized quantitative analysis of mitochondrial networks and could provide insight into mitochondrial dysfunction, which is associated with aging, neurodegenerative disorders, cardiomyopathies, metabolic syndrome, cancer, and obesity.
Form and function are intimately linked in mitochondria. They adapt to cellular requirements by changing shape, motility, and tethering together into tubular networks. However, studying this organelle’s dynamics is challenging. Most techniques can only obtain a limited amount of data and require manual identification and classification of complex mitochondrial morphologies.
To automate and standardize mitochondrial analysis, Dr. Chevrollier’s research team used Y-shaped micro patterned coverslips that allow fibroblasts cells to spread out into one of three sizes of equilateral triangular shapes. The patterns let the cell’s mitochondrial network to spread into the three corners of the triangles and limit the occurrence of overlapping mitochondria. The researchers could then produce a 3D model of the dynamic mitochondrial network by analyzing wide-field fluorescence images of the cells with Imaris.
“Mitochondria form a dynamic, interconnected network that is intimately integrated with other cellular compartments,” said Dr. Chevrollier, whose laboratory and research group are affiliated with the French National Institute of Health and Medical Research (Inserm U1083) and Centre National de la Recherche Scientifique (CNRS UMR 6214). “Quantitative investigation of mitochondrial dynamics with Imaris offered new perspectives for understanding the relationship between mitochondrial form and function.”
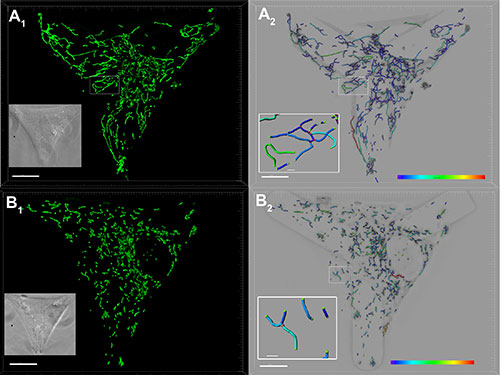
Image courtesy of Arnaud Chevrollier
Imaris Filament Tracer
The researchers used Imaris Filament Tracer to automatically detect mitochondrial filaments in three dimensions and analyzed mitochondrial parameters in single cells and cell populations. They examined the total mitochondrial volume per cell, the connectivity of the mitochondrial network, the number of mitochondrial branch points, and general mitochondrial organization. Imaris also provided a way to color code each subpopulation of mitochondria and to visualize the tubule’s tip, Dr. Chevrollier said. The researchers also used the interactive 3D visualization of isosurfaces together with Imaris Coloc results to identify the contact between mitochondria and organelles such as the endoplasmic reticulum.
By analyzing mitochondria dynamics with this new approach, the researchers found that the volume and cellular distribution of mitochondria is affected by mutations in the OPA1 and MFN2 genes, which are known to be involved in mitochondrial fusion.
“This imaging investigation of mitochondrial dynamics opens new perspectives for establishing the relationship between the organization of the mitochondrial network and pathological conditions,” Dr. Chevrollier said. “The role of mitochondrial division and its potential as a therapeutic target for neurodegeneration, call for the development of our approach towards a high throughput drugs screening.”
The researchers imaged the mitochondrial network in control (A) and mitochondrial fusion gene OPA1 mutated (B) fibroblasts (scale bars: 10 microns). Fibroblasts settled on coverslips with Y-shaped concave Cytoo micropatterns adopt standardized triangular shapes. A1, B1: The researchers labeled the mitochondria with MitoTracker Green and analyzed deconvolved images with Imaris Filament Tracer. A2, B2: The color codes highlight the different lengths of the mitochondrial tubules between branch points. Details show the tips of mitochondrial tubules in green and the network branch points in red (Scale bars : 1 micron).
See a related movie showing the sequential analysis of the mitochondrial network below:
© Oxford Instruments 2024
