
Hardware Solutions
Applications
 Part of the Oxford Instruments Group
Cell Biology
Sarah Cohen, Alex Valm and their colleagues developed a multispectral image acquisition technique that can achieve live-cell six-color fluorescence imaging. By combining their technique with Imaris, the researchers are studying how various organelles interact to coordinate cellular functions.
“Recently, it has become clear that sites of close apposition between organelles, called membrane contact sites, are crucial for exchanging metabolites such as lipids and calcium,” said Cohen, a visiting fellow in Jennifer Lippincott-Schwartz’s lab at the Eunice Kennedy Shriver National Institute of Child Health and Human Development. “Learning more about how metabolites transfer at membrane contact sites will allow us to better understand a variety of metabolic processes, with implications for many diseases including diabetes, neurodegeneration, and viral infection.”
Tracking individual organelles
Fluorescent proteins and dyes are very useful for labeling and tracking various types of cells, organelles, or molecules. However, when more than three or four colors are used, it becomes difficult to distinguish them because of overlap in the excitation and emission spectra of the fluorophores. To solve this problem, the researchers used lattice light sheet microscopy with six laser lines to sequentially excite the fluorophores in the sample and a new linear unmixing algorithm based on the excitation spectra of the fluorophores. Using this approach, the researchers could image the whole 3-D volume of the cell in under 10 seconds, which is fast enough to track six differently labeled individual organelles.
“This approach can be used to study any molecule that is amenable to tagging with a fluorescent protein or dye,” said Cohen. “It is useful for answering questions that can’t be answered by visualizing only two or three types of molecule at once.”
Although many software packages have tools for measuring colocalization between structures, the researchers wanted to know more than whether two structures were simply in the same place at the same time. The Imaris distance transformation function, which calculates distances between objects, allowed them to quantify the fraction of a certain organelle in contact with another organelle. This let them answer questions such as, of 100 lipid droplets in a cell, how many are touching mitochondria and how many are touching a peroxisome? They were also interested in whether the same lipid droplets were touching both mitochondria and peroxisomes.
“We used Imaris because of its user-friendly interface and strength in segmenting 3-D data,” said Cohen. “Imaris also has many built-in functions that were useful for our study, such as the distance transformation function.”
Beyond collocation
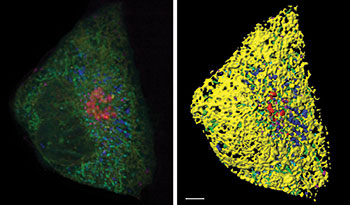
Figure 1: A Cos-7 fibroblast cell labeled with fluorophores targeted to the endoplasmic reticulum (yellow), mitochondria (green), Golgi (red), lysosomes (magenta), peroxisomes (cyan), and lipid droplets (blue). Left: volume rendering of 6-color lattice light sheet data. Right: segmentation using the surfaces tool in Imaris. Scale bar: 5 microns. Courtesy Sarah Cohen, Eunice Kennedy Shriver National Institute of Child Health and Human Development.
For the study, the researchers acquired images of cells that expressed fluorescent proteins targeted to lysosomes, mitochondria, the endoplasmic reticulum, peroxisomes, and the Golgi and were incubated with a dye that labeled lipid droplets. They began by segmenting each organelle with the Imaris surfaces tool using smoothing, background subtraction, and manual thresholding (Figure 1). They made use of the option to split touching objects for globular organelles such as lipid droplets, peroxisomes, and lysosomes and also excluded any objects smaller than 10 voxels. The researchers then performed a distance transformation on each segmented organelle. This process creates a new channel, where the value of each voxel represents the distance to the target organelle (Figure 2) and makes it possible to calculate the distance between any pair of organelles.
Focusing on the globular organelles, the researchers calculated the distance to each of the other labeled organelles. Organelles showing a distance of 0 were considered to be interacting. Using this approach, the researchers found that of 131 lipid droplets in the cell shown in Figure 1, 34 were touching peroxisomes, 123 were touching mitochondria, 92 were touching endoplasmic reticulum, 16 were touching Golgi, and 18 were touching lysosomes. Because Imaris gives each lipid droplet a unique ID, the researchers could also calculate how many of the lipid droplets were touching mitochondria and how many are also touching peroxisomes, for example.
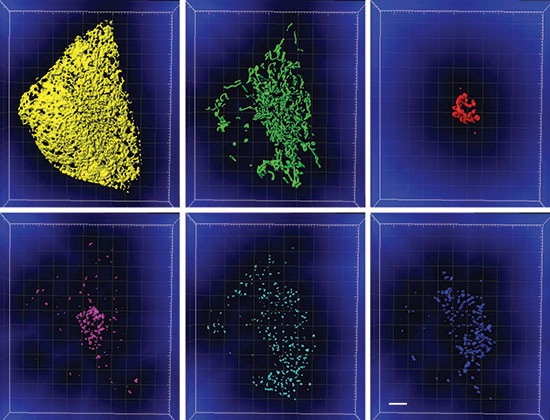
Figure 2: The segmented organelles shown in Figure 1 with the distance transformation channel shown in blue. The voxel intensity represents distance from the segmented organelle. Scale bar: 5 microns. Courtesy Sarah Cohen, Eunice Kennedy Shriver National Institute of Child Health and Human Development.
“Using this approach, we were able to answer questions about the complex coordination between organelles,” said Cohen. “These questions would not have been possible to answer by looking at only two or three different organelles at once.”
The researchers plan to use their multispectral imaging approach with Imaris to study organelle interactions in a variety of cell types and during different cellular processes such as cell migration and cell division. They are also interested in finding out how organelle contacts shift after perturbations such as infection or treatment with different drugs.
© Oxford Instruments 2024
