
Hardware Solutions
Applications
 Part of the Oxford Instruments Group
Hepatology
Hepatitis C viral infection causes chronic liver disease that often leads to liver transplant. However, after a transplant most patients have a recurrence of the virus. In particular, patients with active viral replication process before the transplant often have an increased viral load immediately following liver transplantation.
Researchers led by Dr. Xavier Forns from the Institut d'Investigacions Biomèdiques August Pi i Sunyer, in Barcelona set out to study the viral kinetics of hepatitis C infection to better understand the dynamics of the infection after liver transplantation, which could also reveal more about dynamics that occur early in an infection.
They analysed changes in receptor expression following infection of the newly transplanted liver and examined the influence of receptor expression on virus kinetics. “This is the first study that analyzes hepatitis C virus receptor expression in the setting of liver transplantation and correlates it with hepatitis C infection kinetics,” says Laura Mensa, a member of the research team.
The researchers used Imaris, the most powerful and versatile 3D and 4D image visualization and analysis software solution on the market for researchers in life sciences, to quantify hepatitis C virus receptor expression in formalin-fixed paraffin-embedded liver biopsies. The team performed colocalization analysis of these receptors as well as tight-junction proteins thought to play a role in hepatitis C virus gaining entry into the liver. Mensa says that the Imaris software was intuitive and easy to use.
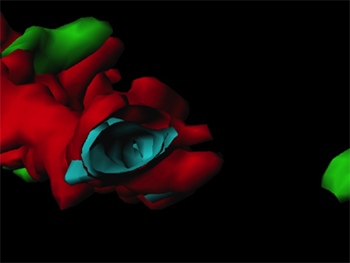
The researchers acquired confocal images of the liver biopsies using 488 nm, 561 nm, or 633 nm laser lines and then carried out surface rendering on the images using Imaris. They selected an individual threshold for each channel and used these threshold levels for all subsequent image samples. The sum of intensities above the threshold for each voxel and number of positive voxels (those with intensity above the established threshold) were calculated for each sample. Acquiring ten images captured the entire liver biopsy. For each biopsy, the sum of intensities and the number of positive voxels was calculated from the geometrical mean of the individual values obtained in different acquisitions.
The researchers then analyzed the colocalization of the tight-junction proteins claudin-1 and occludin in 20 selected specimens. They acquired sequential z-sections of stained samples through the entire paraffin section and used these to reconstruct a 3-D image volume on which colocalization analyses was performed with Imaris. Surface rendering, channel masking, and manual thresholding were used to calculate protein colocalization statistics for the 3-D volume.
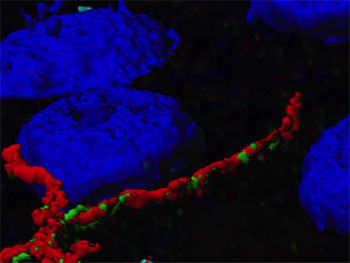
They calculated the amount of colocalization in the 3-D volume by dividing the total number of colocalized voxels by the total number of voxels above the threshold in each channel. As a second measure, they calculated the intensity of colocalization between claudin-1 and occludin by calculating the correlation between the intensities of the colocalized voxels (Pearson correlation coefficient).
Performing the colocalization analyses on 3-D reconstructions meant that the data more accurately reflected reality, says Mensa. She adds that Imaris allowed observation of the sample from any angle and generated cross-sections of the 3-D reconstructions so that the interior parts were visible.
The imaging studies combined with other analyses showed that hepatitis C receptor levels at the time of liver transplant seem to regulate early virus kinetics and that virus recurrence after transplant was associated with higher levels of claudin-1 and occludin in the cell membrane of liver cells.
Research Paper: Hepatitis C Virus Receptors Claudin-1 and Occludin After Liver Transplantation and Influence on Early Viral Kinetics, Hepatology, 2011, Vol. 53, Issue 5, pp. 1436–1445, DOI: 10.1002/hep.24110.
© Oxford Instruments 2024
